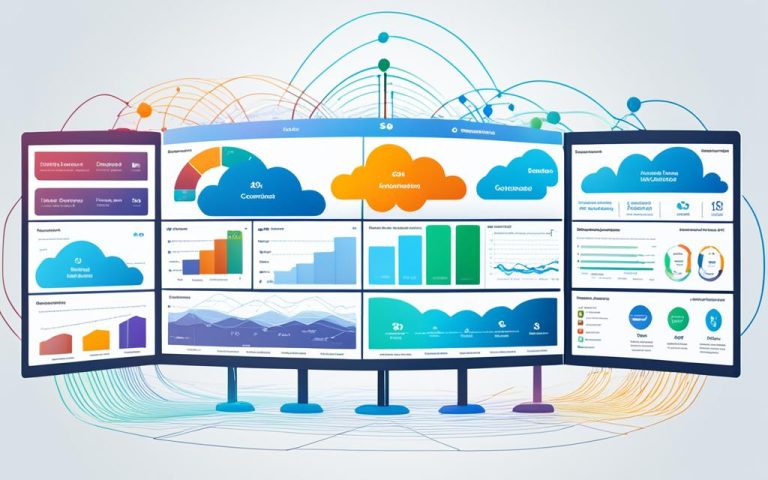
Cloud Visualization Tools play a crucial role in effectively managing and optimizing your cloud network topologies. One of these powerful tools is Network Topology, which provides a comprehensive visualization of your network infrastructure.
With Network Topology, you can gain valuable insights into your Virtual Private Cloud (VPC) networks, hybrid connectivity, and connectivity to Google-managed services. This tool collects real-time telemetry and configuration data to generate a graph representation of your deployment.
Using Network Topology, you can analyze network performance, troubleshoot issues, and have a clear understanding of the topology of your deployments. It captures six weeks of history and visualizes entities and connections based on communication and traffic between resources.
Discover the power of Cloud Visualization Tools like Network Topology to enhance your infrastructure visualization, performance analysis, and troubleshooting capabilities.
How Network Topology Works
Network Topology is a powerful visualization tool that leverages real-time telemetry and configuration data to provide a comprehensive understanding of your network infrastructure. By capturing elements such as configuration information, metrics, and logs, Network Topology can infer relationships between resources and generate a detailed graph representation of your deployment.
With Network Topology, you can gain valuable insight into your network through its infrastructure view. This view includes Virtual Private Cloud (VPC) networks, hybrid connectivity, connectivity to Google-managed services, and associated metrics. Additionally, Network Topology offers a specialized GKE view, allowing you to explore the infrastructure of Google Kubernetes Engine (GKE) deployments, including clusters, namespaces, workloads, and pods.
The tool visualizes this information in a graph format, where nodes and lines represent entities and connections within your network. This graphical representation enables you to easily identify the relationships between various resources and navigate the complexity of your deployment.
One of the key advantages of Network Topology is its simplicity and ease of use. The tool does not require any additional configurations or agents to function, making it accessible to users of all levels of expertise. Whether you are a network administrator or a developer, Network Topology provides an intuitive interface that allows you to quickly analyze and troubleshoot your network performance.
“Network Topology simplifies the process of visualizing complex network deployments. Its intuitive interface and graph representation provide a holistic view of the network, empowering users to identify and address potential bottlenecks and connectivity issues.”
To further enhance your performance analysis, Network Topology allows you to drill down into various metrics. Whether you need to analyze traffic patterns, identify performance bottlenecks, or troubleshoot issues, the tool provides the necessary insights to optimize your network. You can filter and highlight specific resources for in-depth diagnosis and troubleshooting.
Ultimately, Network Topology provides a powerful and intuitive visualization tool that enables you to understand and analyze your network infrastructure efficiently. By leveraging real-time telemetry and configuration data, it offers a graph representation that simplifies the complexity of your deployment, empowering you to optimize performance and ensure seamless connectivity.
Benefits of Network Topology
Network Topology offers several benefits for users. It provides a comprehensive deployment visualization of the network infrastructure, enabling users to gain valuable insights without the need for additional configurations or agents.
The tool eliminates the need for multiple logs or third-party tools by offering a centralized platform for performance analysis and troubleshooting. Users can easily analyze the performance of their network and identify unexpected patterns through detailed metrics.
Network Topology also offers filtering capabilities that allow users to highlight specific resources for diagnosis and troubleshooting. This enables efficient pinpointing of bottlenecks and facilitates quicker resolution of network issues.
Furthermore, Network Topology provides the ability to view cross-project metrics for network traffic across Shared VPC or VPC Network Peering boundaries within the same organization. This enables users to monitor and optimize network performance across multiple projects, ensuring a seamless experience for end-users.
Benefits of Network Topology at a Glance
| Benefit | Description |
|---|---|
| Deployment Visualization | Comprehensive visualization of network infrastructure |
| Performance Analysis | Identify and analyze network performance through detailed metrics |
| Troubleshooting | Efficiently diagnose and troubleshoot network issues |
| Cross-Project Metrics | Monitor network traffic across multiple projects |
By harnessing the powerful capabilities of Network Topology, users can optimize their network deployments, streamline troubleshooting processes, and enhance overall network performance.

Considerations for Network Topology
When utilizing Network Topology, it is essential to take into account various factors that can impact its functionality. Understanding these considerations will ensure optimal utilization of this powerful tool for visualizing and analyzing your network infrastructure.
Large Topology Graphs
In some instances, the topology graph generated by Network Topology may become too extensive to display within a browser. When this occurs, a truncated graph is shown, potentially resulting in missing connections and nodes. To address this, users have the option to remove projects or resources from the metrics scope or limit the display to the current project. These actions help reduce the graph’s size, enabling better visualization.
Data Collection and Entity Connections
Network Topology captures six weeks of historical data to generate accurate visualizations. It collects information on resource communication and utilizes this data to showcase entity connections within their respective hierarchies. Notably, a connection between entities exists only if relevant base entities actively communicate with each other.
“The visualization provided by Network Topology captivates users, enabling them to gain invaluable insights into the intricate connections within their network infrastructures.”
However, it is important to note that Network Topology might not display resources that did not receive or send any traffic. This nuanced consideration ensures that the visualization accurately represents entities and their communication within the network.
Accurate Visualization and Resource Communication
For accurate visualization, Network Topology relies on consistent data collection and freshness. The tool’s ability to represent entity connections depends on resource communication. As entities interact and exchange data, Network Topology updates the visualization to reflect these dynamic connections.
By considering these factors, Network Topology users can harness the power of this visualization tool for effective network management, analysis, and troubleshooting.
Conclusion
Cloud Visualization Tools, such as Network Topology, play a crucial role in efficiently mapping and managing cloud network topologies. By offering a comprehensive visualization of the network infrastructure, Network Topology merges configuration information with real-time operational data, empowering users to gain a deeper understanding of their networking relationships.
With Network Topology, users can analyze network performance and troubleshoot issues with ease. The tool allows them to view the topology of their deployments, providing valuable insights into the structure and connections of their network assets. By drilling down into metrics and highlighting specific resources, users can optimize their cloud network management and ensure efficient performance analysis.
However, it is important to consider the limitations of Network Topology. Large topology graphs may require truncation, resulting in missing connections and nodes. To address this, users can adjust the metrics scope or display data only for the current project. Additionally, Network Topology captures six weeks of history and visualizes entities and connections based on resource communication. It is crucial to ensure accurate data collection and freshness for precise infrastructure visualization and troubleshooting.
In conclusion, Cloud Visualization Tools like Network Topology offer indispensable capabilities for infrastructure visualization, performance analysis, and troubleshooting in cloud network management. By leveraging these tools, users can efficiently manage their network topologies, optimize performance, and maintain a reliable and secure cloud environment.
FAQ
What is Network Topology?
Network Topology is a visualization tool that shows the topology of your network infrastructure, including Virtual Private Cloud (VPC) networks, hybrid connectivity, connectivity to Google-managed services, and associated metrics.
How does Network Topology work?
Network Topology collects real-time telemetry and configuration data from Google’s infrastructure to generate a graph representation of your deployment. It captures elements like configuration information, metrics, and logs to infer relationships between resources.
What are the benefits of Network Topology?
Network Topology allows users to view the topology of their deployments, analyze network performance, and troubleshoot issues. It provides a comprehensive visualization of the network infrastructure, eliminates the need for multiple logs or third-party tools, and offers filtering capabilities to highlight specific resources for diagnosis and troubleshooting. Users can also view cross-project metrics for network traffic and gain insights into entities with high egress metric values for further analysis.
What are the considerations for using Network Topology?
If there are many projects and the topology graph becomes too large to display in a browser, a truncated graph may be shown with missing connections and nodes. To reduce the graph size, users can remove projects or resources from the metrics scope or show data only for the current project. It’s important to note that the metrics are not sampled or truncated and that Network Topology captures six weeks of history based on resource communication.
Why are Cloud Visualization Tools like Network Topology important?
Cloud Visualization Tools, including Network Topology, provide essential capabilities for efficiently mapping and managing cloud network topologies. These tools offer comprehensive visualizations of network infrastructure, combining configuration information with real-time operational data. They empower users to understand networking relationships, analyze network performance, and troubleshoot issues for precise and efficient management of cloud network topologies.


