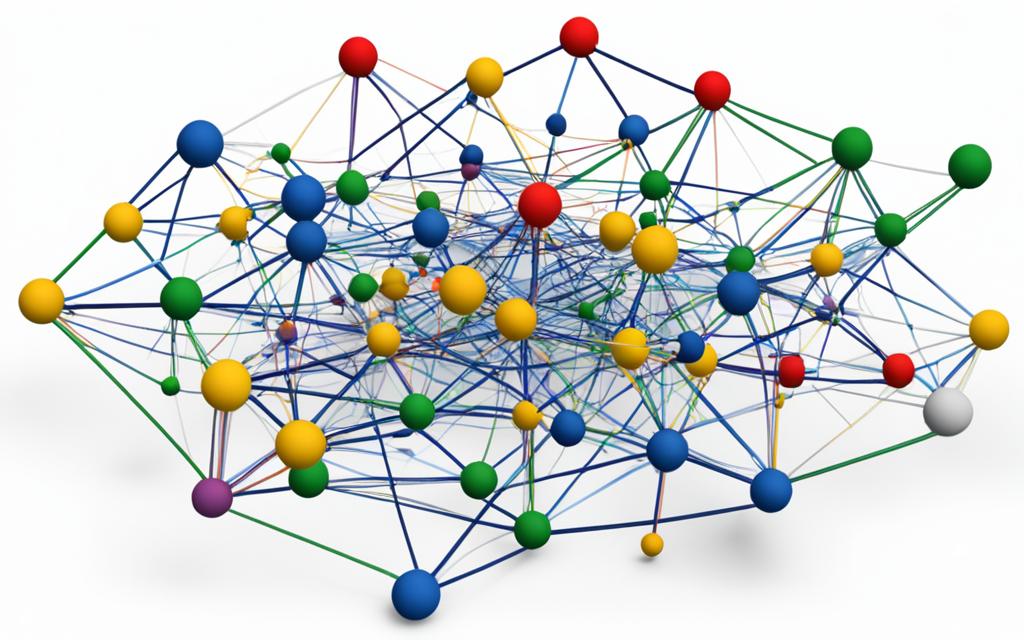
Network clustering, also known as graph clustering or network partitioning, is a way to find groups in a network. It looks for subnetworks that are tightly connected and stand out from the rest. This method helps us understand complex networks better, making it easier to analyze and interpret the data.
This technique has many uses across different fields. In biology, it helps spot genes or proteins that work together. In finance, it finds stocks that move together a lot. In social networks, it uncovers groups and key people. It’s also used in many areas like recommendation systems, market analysis, and image processing.
There are various methods and algorithms for network clustering. Some focus on finding tight groups, while others aim to divide the whole network into clusters. Some even let nodes join multiple groups. Each method has its own strengths and uses.
Getting to know network clustering and using the right algorithms is key to understanding complex networks. Luckily, there are powerful tools out there. yFiles, made by yWorks, is one such tool1. It’s been around since 2000 and is a top choice for graph and diagramming software1. yFiles works on many platforms and can be customized to fit different needs1. It’s great for visualizing complex networks and working with various services1.
Key Takeaways:
- Network clustering finds groups in a network by looking for tight connections and isolated areas.
- It’s used in many areas like biology, finance, social networks, and more.
- There are different ways to cluster networks, each with its own results.
- yFiles is a top tool for network clustering and analysis.
- yFiles has advanced features and can be customized for better results.
Understanding Clustering in Machine Learning
Clustering is a key unsupervised learning method in machine learning. It finds similar groups in a dataset without knowing what to look for. Clustering algorithms look for patterns or maxima in the data. The results can be hard or soft clustering, depending on how data points are grouped.
There are many types of clustering algorithms. These include connectivity, centroid, distribution, and density models.
Connectivity Models:
Connectivity models, like Hierarchical clustering, link data points by their closeness. This method can start with single clusters or one big cluster2. It’s good for finding patterns in data but can take a lot of time for big datasets2.
Centroid Models:
Centroid models, like K-means and K-medoids, put data points near a central point. K-means tries to make these distances as small as possible2. You need to decide how many clusters to make, known as k3. This number can be small or very large, but usually, smaller works better3.
Distribution Models:
Distribution models, such as Gaussian Mixture Models (GMM), think the data comes from different Gaussian distributions. GMM is a popular way to cluster data2.
Density Models:
Density models, like DBSCAN, find areas with lots of data points and connect them into clusters. DBSCAN is good at ignoring noise and finding clusters of any shape2.
Knowing about different clustering algorithms is key in machine learning. Clustering uses unsupervised learning and has many uses. It helps in market research, social network analysis, and more4. Each cluster gets a unique ID, making complex data easier to understand4. Clustering also helps Google in many ways, like making YouTube and Play apps work better4. It can also improve predictions in models like regression and neural networks by using cluster info3.
Clustering is also used in business to group customers for targeted marketing3. It helps find fraud in financial data, saving time and resources3.
With so many clustering algorithms and uses, machine learning models can learn a lot from data and make smart choices based on patterns.
Connectivity Models: Hierarchical Clustering
Hierarchical clustering is a way to group similar data points together in machine learning. It looks at how similar data points are and puts them into groups. This method shows the relationships and structures in datasets.
There are two main ways to do hierarchical clustering: Divisive Clustering and Agglomerative Clustering.
• Divisive Clustering starts with one big group and breaks it into smaller ones. It keeps doing this until each point is in its own group. This method helps find detailed clusters in a dataset5.
• Agglomerative Clustering works the opposite way. It begins with each point as its own group and merges the closest ones together. This way, it shows the big structure of the dataset, combining small clusters into big ones6.
One big plus of hierarchical clustering is making dendrograms. These are like trees that show how groups are connected. At the bottom are the single points, and the biggest clusters are at the top. This helps figure out the best number of clusters for a dataset7.
Using hierarchical clustering, data scientists can organize data by how connected and similar the points are. This method helps them understand the dataset’s relationships and structure. It lets them make better decisions and find patterns they might have missed.
Centroid Models: K Means Clustering
K means clustering is a key method in machine learning that finds local maxima in each step. It needs the number of clusters to be set before starting, making sure data is well-organized. This method works best with big datasets and when clusters are like spheres.
The algorithm begins by randomly placing each data point in a cluster. Then, it updates the cluster centers and re-assigns data to the nearest center. This loop continues until no more changes are made. K means clustering quickly finds a good solution by improving the cluster centers.
“The k-means clustering algorithm minimizes within-cluster variances (squared Euclidean distances) to create Voronoi cells in the data space.”8
Stuart Lloyd introduced K means clustering in 1957, and James MacQueen named it in 1967. The algorithm starts with random centroids or assigns clusters randomly to data points.
- K means clustering aims to reduce the within-cluster sum of squares (WCSS), making it efficient for data organization8.
- Its variations, like spherical K means and K medoids, use different distances for various datasets8.
K means clustering is great for big datasets and stays accurate. It stops when the data assignments don’t change, showing it’s stable.
K means clustering is vital in machine learning for grouping similar data. Its process of refining and efficient methods make it a top choice for many data analysis tasks.
K Means Clustering in a Nutshell
| Advantages | Disadvantages |
|---|---|
| – Efficient for large datasets | – Requires the number of clusters to be specified beforehand |
| – Handles hyperspherical clusters effectively | – Sensitive to outliers or irregularly shaped clusters |
| – Converges quickly to a local optimum | – Initialization methods can impact results |
“K means clustering is a popular centroid model that efficiently partitions datasets into distinct clusters based on proximity to centroids”9
In summary, K means clustering finds local maxima and groups data by distance to centroids. It’s great for big datasets, fast, and accurate. By using K means clustering, machine learning experts can find important patterns in their data.
Distribution Models: Expectation-Maximization Algorithm
Distribution models focus on the chance of data points being in the same group. The Expectation-Maximization (EM) algorithm is a key method10. It uses multivariate normal distributions to figure out the likelihood of data points in different groups.
The EM algorithm is an iterative process aiming to boost the likelihood function. It has two steps: the E-step and the M-step10. In the E-step, it calculates the expected value or posterior probability of hidden variables given the data and current parameters. Then, in the M-step, it updates the parameters to maximize the expected complete data log-likelihood from the E-step.
The EM algorithm is the base for many unsupervised clustering algorithms in machine learning10. It’s used for tasks like clustering in machine learning, computer vision, and natural language processing10. Starting the algorithm means setting initial values for the parameters and incomplete data10.
Benefits of the EM algorithm include its simplicity for many machine learning issues, having closed-form solutions for the M-step, and ensuring the likelihood increases with each iteration11. But, it has downsides like slow convergence, getting stuck in local optima, and needing to consider both forward and backward probabilities11. It’s crucial to know the EM algorithm might end up at a local maximum of the likelihood function, based on the starting values12.
The EM algorithm is applied in many areas, like Natural Language Processing (NLP), Computer Vision, image reconstruction, and parameter estimation11. For instance, the Gaussian Mixture Model (GMM) uses the EM algorithm for soft clustering, distributing observations into clusters with different Gaussian distributions11. You can implement GMM in Python using the Sklearn Library, specifically the GaussianMixture class, for fitting a mixture of Gaussian models11.
To learn more about the Expectation-Maximization algorithm, check out the detailed guide by Analytics Vidhya [source] and the Wikipedia page on it [source]. For a deeper dive, refer to the original paper by Arthur Dempster, Nan Laird, and Donald Rubin on the EM algorithm’s origins and theory [source].
Advantages and Disadvantages of the Expectation-Maximization Algorithm
| Advantages | Disadvantages |
|---|---|
| 1. Ease of implementation | 1. Slow convergence |
| 2. Closed-form solutions for M-step | 2. Convergence to local optima |
| 3. Guaranteed likelihood increase | 3. Consideration of forward and backward probabilities |
Table: Advantages and Disadvantages of the Expectation-Maximization Algorithm
Density Models: DBSCAN and OPTICS
Density models help find areas with different densities in data and group dense areas together. DBSCAN and OPTICS are two key algorithms for this. They work well with clusters of any shape and can spot outliers. These models are great for finding anomalies and clusters in noisy data.
DBSCAN is a method that uses a set value to define close points. It’s good for datasets with different densities and noise. It labels points as core, border, or noise to find clusters efficiently13.
OPTICS is another method that improves on DBSCAN’s limits. It uses reachability and core distances to adapt to different densities. OPTICS doesn’t need to know how many clusters there are beforehand. It also has a plot that helps extract clusters at various levels. This makes it easier to use than DBSCAN but takes more memory1415.
DBSCAN marks noise points directly, while OPTICS sees high reachability distances as noise. This flexibility helps in finding outliers and makes these models more robust14.
Overall, DBSCAN and OPTICS are great at finding clusters in complex data with different densities and shapes. They’re useful for many areas like spotting anomalies, segmenting images, and understanding customer groups. By using these models, data experts can uncover deep insights and patterns in complex data.
Applications of Network Clustering
Network clustering is used in many areas across different fields.
In cybersecurity, it helps model network behavior to spot threats better in crowded networks16. It helps law enforcement find groups and their leaders from data16. Also, it helps fraud teams take down big fraud rings quickly16.
In recommendation systems, it’s key for finding users with similar tastes. This makes recommendations more personal and engaging. It makes users happier by meeting their specific interests.
For market segmentation, it groups customers by their traits. This lets companies make marketing that hits the mark, increasing sales and satisfaction.
Social network analysis uses clustering to find groups and understand social ties. This gives deep insights into who matters, how people connect, and what drives communities. It helps in marketing, sociology, and political studies.
It’s also used in medical imaging, grouping search results, and spotting anomalies. Clustering helps make sense of complex data, leading to smarter decisions and solutions.
“Network clustering has changed many fields by offering deep insights, improving processes, and aiding in smart choices.”
Improving Supervised Learning Algorithms with Clustering
Clustering can make supervised learning algorithms more accurate. It groups similar data points together. This helps capture more patterns and dependencies in the data, leading to better predictions.
Clustering is great when we don’t have much labeled data. It can be used in semi-supervised learning to label more data. This makes the labeled dataset bigger, helping the models work better17.
In supervised learning, clustering helps with feature engineering. We can give cluster labels to data points based on features. These labels can be used in the models, giving more information for predictions. This way, we can explore the data more deeply and find hidden patterns17.
Clustering is also good for dealing with complex, high-dimensional datasets. Algorithms like K-means group similar data together. This makes the data easier to work with and helps the models make more accurate predictions18.
Clustering can also be a step before training a model. It helps find subgroups in the data. This can reveal unique characteristics and relationships, helping the models learn and predict better. Using clustering this way gives a deeper look into the data and models19.
Overall, combining clustering with supervised learning offers new ways to analyze and predict data. Clustering brings insights and boosts the performance of supervised models. It helps in expanding the labeled dataset, improving feature engineering, handling complex data, or as a preprocessing step. This makes supervised learning more comprehensive and accurate181917.
The Most Complete Solution: yFiles
yFiles is the top choice for graph and diagramming software20. It has many features and works on many platforms. This makes it great for developers to make apps that show graphs and diagrams well.
yFiles works on five big platforms: HTML, JavaFX, Java (Swing), WinForms, and WPF21. This means developers can use it in their projects, no matter what programming language they prefer.
yFiles has lots of ways to arrange data visually21. There are over a dozen layouts and hundreds of settings to customize. This lets developers show data in many ways, like complex charts or diagrams.
Another cool thing about yFiles is how it updates in real-time21. Visuals can change as new data comes in. This makes it easy to explore and analyze complex data.
yFiles makes it easy to connect to different data sources21. It works with databases, graph databases, and more. This lets developers use data from many places in their apps.
Developers using yFiles get lots of help and resources21. There are demos for many features, like Isometric and Network Flows. These demos help developers get started.
yFiles also has over 100 examples and tutorials21. This helps developers learn fast. Plus, they get free premium support to help with any problems.
Developers can talk directly to yFiles’ Customer Success Team21. This ensures they get the support they need to succeed with yFiles.
yWorks has been making graph and diagramming software for over 20 years22. yFiles is their top product, known for its innovation and support2022. It’s the best choice for showing complex data, analyzing graphs, or making diagramming apps.
Network Clustering Synonyms
Network clustering is also known as graph clustering and graph partitioning. It’s about finding groups in a network that are closely connected and not too connected to others. These terms all mean the same thing: finding groups in a network.
When we talk about network clustering, we see different views. Graph clustering looks at the network’s structure. Graph partitioning is about dividing the network into parts. Both focus on understanding the network better.
Network clustering includes graph clustering and graph partitioning. The goal is to break a network into meaningful parts.
Types of Clustering Algorithms
There are two main types of clustering algorithms: hierarchical and partitional. Hierarchical algorithms group nodes together or split them, creating a tree-like structure. Agglomerative and divisive are two ways to do this.
Partitional algorithms divide the network into separate clusters. The k-means and k-medoids algorithms are well-known. K-means puts nodes in clusters based on distance. K-medoids uses a node in each cluster to represent it.
Advances in Density-Based Clustering
Density-based clustering finds clusters where nodes are close together. This method is great for finding clusters of any shape. DBSCAN and SSN are examples of density-based algorithms.
DBSCAN finds clusters by looking at local density. SSN looks at connections between nodes. These methods are good at finding clusters that are not easy to spot.
This approach helps us understand networks better, even if they have unusual clusters.
Applications and Implications
Network clustering is used in many areas, like social networks and biology. It helps find groups in social networks and understand biological networks. It also improves recommendation systems.
It can also make supervised learning algorithms work better. By using clustering, these algorithms can handle complex data better. This leads to more accurate predictions.
In conclusion, network clustering is about finding groups in networks. It uses different algorithms to do this. It helps us understand social networks, biology, and more. By studying networks, we can learn a lot about how things are connected.
Network Clustering Definition and Variations
Network clustering is about finding groups of closely connected parts in a big network. It’s used in many areas, like making networks work better and finding patterns in data. The way it works can change based on the problem it’s solving.
Some methods look for groups that are very connected. Others try to split the whole network into groups. Some even let groups overlap. This makes it easier to find patterns and solve problems.
Network clustering helps mobile networks save money and work better23. By managing networks in groups, they can use resources better23. This way, they can turn things on and off based on need, saving energy23. It also helps avoid problems when many users use the same network at once23.
There are many ways to cluster networks, each with its own goal23. Making sure each group fits together well is key for a good network23. Some networks, like those in malls, work better when managed together23.
The SCAN algorithm is fast and efficient, visiting each part only once24. It does well in finding groups in networks, beating other methods24. This makes it a quick choice for network problems24.
Cluster analysis is used in many areas, like marketing and biology25. It helps in understanding groups in many fields25. There are different ways to do cluster analysis, like looking at groups in a step-by-step way or using a model25.
Getting the data ready is key for cluster analysis25. Cleaning the data and making sure everything is on the same scale is important25. There are also ways to deal with missing data and pick the most important features25.
Network clustering and its variations help us understand complex networks better2324. It’s a powerful tool for making networks work better and improving how they handle data2324.
Conclusion
Network clustering is a key method that helps in many areas. It finds groups of closely connected nodes, showing us hidden patterns and how to use resources better.
For businesses, it makes it easier to see how much capacity is available26. It also makes networks work better and faster26. This way, companies can use resources wisely and manage power and load well26. It reduces problems between sites and makes customers happier26.
Technically, using network clustering algorithms like those in Apache Spark makes analyzing big network data more efficient and accurate27. These algorithms use less memory and run faster than old methods27. They also make handling big data better27.
Comparing Neural Network Clustering (NNC) and Hierarchical Clustering (HC), we see that using both together gets better results28. NNC is better at clustering real-world data that doesn’t follow perfect patterns28.
In short, network clustering is a strong tool that makes networks better, helps manage resources, and improves user experience. It gives insights from business, tech, and analysis sides. This helps companies stay competitive in today’s data-rich world.
FAQ
What is network clustering?
Network clustering, also known as graph clustering or network partitioning, is a way to find groups in a network. It looks for subnetworks that are closely connected and stand out from the rest.
What are the applications of network clustering?
It has many uses, like in molecular biology, making recommendations, market analysis, social network studies, and image processing.
What is clustering in machine learning?
In machine learning, clustering is a key unsupervised method. It groups similar items together without knowing what to look for beforehand.
What is hierarchical clustering?
Hierarchical clustering builds a tree of clusters. It starts with each item in its own group and merges the closest ones until just one group is left.
What is K means clustering?
K means clustering finds clusters by looking for the center of each group. You need to know how many clusters you want before starting.
What are distribution models?
Distribution models look at how likely data points are to be in the same group. The Expectation-Maximization (EM) algorithm is a well-known method in this area.
What are density models?
Density models find clusters by spotting areas with more data points. Algorithms like DBSCAN and OPTICS are great for this.
How can clustering enhance the accuracy of supervised learning algorithms?
By grouping similar data, clustering can make supervised learning work better. It uses these groups as extra information for the learning models.
What is yFiles?
yFiles is a powerful tool for creating graphs and diagrams. It has top-notch visualization and works with many platforms and languages.
What are the synonyms for network clustering?
Other names for network clustering are graph clustering and graph partitioning. They all mean the same thing: finding connected groups in a network.
What is the definition of network clustering and its variations?
Network clustering is a way to find connected groups in a network. The way it’s done and what it aims to find can change based on the problem at hand.
Source Links
- https://www.yworks.com/pages/clustering-graphs-and-networks – Clustering Graphs and Networks
- https://www.linkedin.com/pulse/clustering-machine-learning-explained-data-and-analytics-magazin-7hepe – Clustering in Machine Learning explained
- https://www.techtarget.com/searchenterpriseai/definition/clustering-in-machine-learning – What is Clustering in Machine Learning? Definition from TechTarget
- https://developers.google.com/machine-learning/clustering/overview – What is Clustering? | Machine Learning | Google for Developers
- https://en.wikipedia.org/wiki/Cluster_analysis – Cluster analysis
- https://www.geeksforgeeks.org/clustering-in-machine-learning/ – Clustering in Machine Learning – GeeksforGeeks
- https://www.geeksforgeeks.org/hierarchical-clustering/ – Hierarchical Clustering in Machine Learning – GeeksforGeeks
- https://en.wikipedia.org/wiki/K-means_clustering – k-means clustering
- https://neptune.ai/blog/k-means-clustering – K-Means Clustering Explained
- https://www.geeksforgeeks.org/ml-expectation-maximization-algorithm – ML | Expectation-Maximization Algorithm – GeeksforGeeks
- https://www.analyticsvidhya.com/blog/2021/05/a-comprehensive-guide-to-expectation-maximization-algorithm – A Comprehensive Guide to Expectation-Maximization Algorithm
- https://en.wikipedia.org/wiki/Expectation–maximization_algorithm – Expectation–maximization algorithm
- https://www.geeksforgeeks.org/dbscan-clustering-in-ml-density-based-clustering/ – DBSCAN Clustering in ML | Density based clustering – GeeksforGeeks
- https://www.geeksforgeeks.org/ml-optics-clustering-explanation/ – ML | OPTICS Clustering Explanation – GeeksforGeeks
- https://medium.com/@okanyenigun/optics-clustering-navigating-through-density-variations-20357e719997 – OPTICS Clustering: Navigating Through Density Variations
- https://cambridge-intelligence.com/keylines-network-clustering/ – Network Clustering
- https://www.freecodecamp.org/news/8-clustering-algorithms-in-machine-learning-that-all-data-scientists-should-know/ – 8 Clustering Algorithms in Machine Learning that All Data Scientists Should Know
- https://www.analyticsvidhya.com/blog/2016/11/an-introduction-to-clustering-and-different-methods-of-clustering/ – Clustering | Different Methods, and Applications (Updated 2024)
- https://www.datacamp.com/blog/clustering-in-machine-learning-5-essential-clustering-algorithms – Clustering in Machine Learning: 5 Essential Clustering Algorithms
- https://www.yworks.com/pages/analyzing-network-data – Analyzing Network Data
- https://www.yworks.com/products/yfiles – yFiles product details
- https://www.yworks.com/pages/network-monitoring-visualization – Network Monitoring Visualization
- https://www.parallelwireless.com/blog/network-clusters-understanding-and-optimizing-their-potential/ – Network Clusters: Understanding and Optimizing Their Potential • Parallel Wireless
- https://www.khoury.northeastern.edu/home/yzsun/classes/2014Spring_CS7280/Papers/Clustering/SCAN.pdf – PDF
- https://www.displayr.com/understanding-cluster-analysis-a-comprehensive-guide/ – A Comprehensive Guide to Cluster Analysis: Applications, Best Practices and Resources
- https://www.parallelwireless.com/blog/network-clusters-understanding-and-optimizing-their-potential – Network Clusters: Understanding and Optimizing Their Potential • Parallel Wireless
- https://www.ncbi.nlm.nih.gov/pmc/articles/PMC6179193/ – CASS: A distributed network clustering algorithm based on structure similarity for large-scale network
- https://www.nature.com/articles/s41598-023-32790-3 – Comparison of hierarchical clustering and neural network clustering: an analysis on precision dominance – Scientific Reports

